To keep your clients happy, you must regularly update them on the work you’re doing. More importantly, you must demonstrate how your strategies deliver value to them.
Top agencies do this with client reports, sharing data to spark conversations and deliver insights that make a difference.
In this article, you’ll learn what client reporting is and why it matters. You’ll also get top tips and tools for creating standout reports.
What is client reporting and why do you need it?
Client reporting involves gathering performance data and sharing it with clients to show how you’re helping them reach their goals.
Reports are crucial to the agency-client relationship, ensuring clarity and keeping campaigns moving in the right direction.
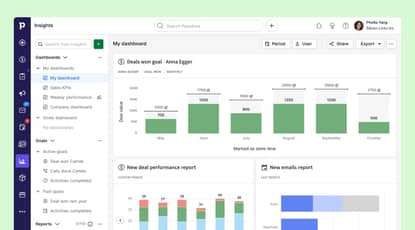
Here’s how a report might look:
Depending on your work, client reports may provide insights on key performance indicators (KPIs) such as sales volume, website traffic, email engagement, social media engagement and click-through rate (CTR).
Bringing this information together in one place helps:
Educate clients about your work and how your activities deliver value
Provide actionable insights to inform client decisions on strategy and spending
Track progress toward a goal or objective
Improve campaigns to generate more leads and sales
Keep you accountable for your work and your clients accountable for goal-setting
Facilitate conversations around results, progress and future campaigns
The nature of your client relationship determines how often you’ll send reports. For example, if you want to track short-term sales and marketing efforts, weekly reports will show clients which channels convert best.
However, if you want to monitor longer-term tactics like search engine optimization (SEO), a monthly report will provide more data to show changes in trends. You can also report on activities quarterly or annually.
Alternatively, you can share real-time dashboards to give clients access to the latest data. Constant access can be useful for monitoring the performance of high-volume sales activities such as cold calling where results are more immediate.
How to create a client report
A good client report should give users vital information in an easy-to-understand format so they can make informed decisions (and you can demonstrate your value).
Here are some practical steps for getting started.
1. Establish what your client needs
Client reporting starts during the onboarding process. Before you start work, establish your client’s goals and how they measure success.
This will help you understand what to focus on in your campaigns. It will also give you direction for your first reports.
Here are some strategic questions to ask your client:
What are the top priorities for your business?
What are your short- and long-term goals?
What are your goals for this campaign?
What channels do you use to market your brand?
Who is your target audience?
What metrics are important for measuring success?
What are your financial goals?
2. Choose the right metrics and key performance indicators
When you know what your client wants to achieve, pin down the key performance indicators and metrics that show progress toward their goals. These are the activities and data points you’ll track and report on.
Again, the client should be heavily involved in the process. However, it’s important to remember they may not have the sales or marketing knowledge to clearly define metrics.
If your client is unsure of what to measure, work with them to set SMART goals:
Specific. Define exactly what you want to achieve. Make goals clear and detailed
Measurable. Choose key metrics to track and evaluate progress
Achievable. Ensure goals are realistic within a set timeframe and budget
Relevant. Align goals with the client’s business objectives
Time-bound. Set a clear end date for completion
For example, say your client wants to increase monthly sales revenue. Here’s what a SMART goal might look like:
| Specific | We’ll increase our revenue by $20,000 this quarter |
| Measurable | To increase sales, we’ll book 10 weekly meetings, send 50 outreach emails a week and make five phone calls a day |
| Achievable | We’ll sign 10 new contracts with customers |
| Realistic | We’ll focus on upgrading active users to premium plans |
| Time-bound | We’ll achieve this by the end of the second quarter of 2025 |
The SMART goal tracks metrics on actions directly related to increasing revenue (monthly sales bookings, monthly sales growth, lead conversion rate and email conversion rate). These metrics will help you make data-driven decisions about what’s working and where to improve.
3. Gather the data for your report
Once you know your metrics, use relevant analytics tools to monitor them and collect data for your report over the defined period (e.g., monthly or quarterly).
You likely already use analytics tools in your work, but here are some popular options for sales and marketing activities:
Pipedrive for tracking, analyzing and reporting on sales and email marketing campaigns
Google Analytics for monitoring website traffic, traffic sources, search data and audience demographics
Google Ads Editor for tracking Google Ads conversions, CTR, position and ad spend
Semrush for analyzing SEO and content marketing campaign performance
Sprout Social for examining social media performance
Analytics platforms provide vast amounts of data, a lot of which can look good in a client report.
That said, avoid including anything outside of the agreed metrics in your reports. Otherwise, you risk important data getting lost among insights that don’t influence strategic decisions.
For example, showing an increase in email newsletter subscribers indicates popularity and looks impressive on a chart but adds little to the client’s bottom line.
A better metric to report on is new leads generated from the newsletter, which is directly tied to revenue.
Note: Many analytics tools include client reporting features that automatically collect relevant data. If you’re gathering data from multiple sources, you need to export it to present it in a single report.
4. Structure your report in a user-friendly way
Client reports tend to be data-heavy, so it’s important to format them in a way that’s easy to digest.
Here’s a simple framework to follow:
Clear, concise title that explains what the report is about (e.g., Email Marketing Engagement Report: September 2024)
Summary of client goals and key findings from the reporting period
Sales or marketing data, including context for what it means
Details of next steps
Assume your client will be skim-reading the report. What needs to catch their eye? Here are some ways to grab attention:
Prioritize the most relevant information
Use graphs and charts to quickly show changes in performance (more on these soon)
Use bullet points to break up complex content, format lists and highlight important insights
Use bold text to draw attention to key insights
Make clients feel like they’ve learned everything they need to know, even if they haven’t consumed every data point.

5. Share your report
You can share a client report as a dashboard, PDF document, slides or spreadsheet. The right option depends on your client and how you’re presenting data.
During client onboarding, agree on how often and in what format you’ll share reports. The type of campaign you’re reporting on will help you determine the best cadence.
For example, if you commit to sharing daily client reports, a real-time customizable dashboard is more efficient than manually visualizing data in Excel. It’s also more effective for discussion and collaboration.
However, if you’re presenting data to stakeholders at a monthly meeting, a PDF might be a thorough and user-friendly way for clients to digest information.

5 best practices for creating standout client reports
While client reports offer straightforward data, you can also make them interesting. Here are six expert tips for creating engaging reports.
1. Automate the client reporting process
As crucial as client reporting is, ensure it uses your resources efficiently. Automation can free up your time (and energy) and streamline the reporting process.
Use an automated client reporting option that collects data and paints a picture for you.
Choose sales or marketing software that includes client reporting tools. It will centralize your activities and help you track and report on performance all in one place.
For example, a tool like Pipedrive gathers real-time email analytics you can quickly filter and group to create custom reports.
You can also share live dashboards like the one below with one click to save time on exporting and emailing data.

If your reports pull in data from several marketing channels, use templates and re-use existing reports so you’re not starting from scratch each time.
Sticking with the same template also makes reports familiar and easier to digest. You can use the time you save on structuring and admin to personalize data and summaries so they’re relevant to the client.
Get organized with your free sales pipeline excel template
2. Keep reports simple by focusing on what matters
Clients often only want to know that what you’re doing is working. To communicate results, stick to need-to-know information. With each section of your report, ask: why does this matter to the client?
If the information doesn’t directly relate to their goal, don’t include it. Your report should be comprehensive but concise.
Get your message across clearly by using simple language over technical jargon. Limit decimal points on number-heavy tables so numbers are easier to process.
If you’re using data from several channels, segment it so clients can focus on one thing at a time (e.g., include one section on email marketing and another on paid advertising). Segmentation helps prevent data overwhelm and lets you communicate essential ideas without unnecessary distractions.
3. Turn data into a story to engage clients
Data storytelling turns numbers into a compelling narrative. It helps you break down results and explain concepts in an easy-to-understand and engaging way.
This before-and-after example by Storytelling With Data shows the difference between a data chart and one enriched with storytelling:

To create an effective data story, add a narrative and visualizations to the data you’ve chosen for your report.
Start by looking for connections, trends or outliers in data points.
Are there any interesting or unusual correlations?
Is there unexpected growth in a particular area?
How does one data point compare to another, and what can you draw from it?
For example, you may find that emails have a higher conversion rate on certain days. Or that an offer did better after changing the CTA button color on a sales page. Your hypothesis for why these things happen makes for interesting stories.
Once you have the foundation for your story, you can develop your narrative. Tell your story linearly, starting from the beginning (why you’re telling this story) and taking the client on a journey to the outcome.
Here’s a basic framework to follow:
Context. What situation does the data present? This acts as your attention-grabbing hook.
Character. Who are the main players in your story (e.g., tactics and products or services)?
Problem. What conflict does the data present?
Resolution. What are the actionable insights, values or next steps needed to resolve the conflict?
Finally, use data visualization to communicate key points. Visuals help add context, highlight important findings and improve understanding. They also turn large amounts of data into digestible information.
For example, this chart from a Pipedrive performance report helps viewers understand the number of sales actions faster than numbers in a spreadsheet:

You can visualize data in many ways, including:
Column and bar charts to compare different items
Pie charts to show parts of a whole
Scorecard charts to summarize a single metric
Table charts to compare related values or display qualitative information (e.g., monthly sales over time)
Scatterplots to show the relationship between and changes in two variables (e.g., revenue vs. expenses)
Screenshots to show changes to web pages for ads
When choosing visuals, consider what you want clients to learn and how it relates to your story. Stick to the data that matters and display it in the simplest way possible.
4. Include good and bad news in your reports
While it’s natural to want to focus on the good work you’ve done in your report, it’s important to share what didn’t go to plan.
A positive agency-client relationship relies on honesty. Being transparent about failures helps build trust.
Context is important here. If a campaign is performing below expectations, explain why.
In some cases, a drop in performance might be out of your control because of market or seasonal factors. Communicating those reasons helps clients understand that the quality of your work isn’t the issue.
If an issue relates to your work, offer solutions. Give details on where you went wrong and propose a different approach.
Being proactive tells the client that you’re working in their best interests. It’s also the fastest way to improve future performance.
5. Discuss reports with your client
Each time you send a report, use it as an opportunity to chat with your client about results, share concerns and brainstorm future approaches.
Client communication is particularly important with new clients as you both learn how the other works. A call or meeting will help you explain campaigns, suggest changes and walk clients through data they may not be familiar with.
It’s also a chance to get valuable feedback. Ask your client if the data is easy to understand and if there’s anything else they’d like to see.
Use your clients’ comments to evolve reports so you can deliver data that informs decisions.
Tip: If you’ve had a big success or hit an important milestone, share it immediately. Proactively reporting on your wins shows the client that you’re prioritizing their campaigns.
5 client reporting tools
If you’re sharing reports regularly, client reporting software makes it easy to collect the data you need, analyze it and turn it into visually engaging insights.
Here are five efficient reporting tools to streamline your work and get more done in less time.
1. Pipedrive
Pipedrive’s CRM software brings your sales activities and client data sources together so you can simplify your sales process and close more deals.
Pipedrive’s Insights feature includes customizable reports and dashboards with real-time performance data.

Use these customizable elements to track default sales criteria or add custom metrics for your campaigns. You can also choose filters and turn metrics into interactive charts, graphs and tables, so clients always see relevant data.
Pricing: Pipedrive has pricing plans to suit different needs. Get started with a 14-day free trial.
2. Looker Studio
Looker Studio (formerly Google Data Studio) is a comprehensive free tool for turning Google Analytics data into visual reports.
Users can access a wide range of customizable report templates and interactive dashboards with data covering website traffic, keyword rankings, e-commerce performance, backlinks and more. Users can also share reports with clients in a click.

Users of Google Analytics and Google Search Console will appreciate the familiar interface of Looker Studio. While the tool’s range of features may involve a steep learning curve, Google’s Looker Studio user guides can help you get started.
Pricing: free with a Google account.
3. Tableau
Tableau is an analytics and data visualization tool that lets users pull data from multiple sources and turn it into engaging charts and graphs.
The software design is intuitive and accessible for various skill levels, using a drag-and-drop editor to simplify the creation of visuals.

Reports are fully interactive and customizable. Users can also share real-time data insights with clients. More powerful features such as AI-powered analytics are only available on higher-paid plans.
Pricing: paid plans start at $75 per user per month. Users can explore the platform for free using Tableau Public.
4. Microsoft Power BI
Microsoft Power BI is a visualization tool that lets marketing agencies build real-time reports and dashboards from scratch or with customizable templates.
You can use the software to create datasets from any source and build stories using 25+ visualization types.

While the intuitive drag-and-drop editor can achieve professional results, some users looking to create unique reports may find Power BI’s customization options limiting.
Pricing: paid plans start at $10.00 per user per month. A basic free version is available to users with a Microsoft Fabric account.
5. Whatagraph
Whatagraph is a digital marketing platform for tracking performance and reporting on results. Users can gather data from over 50 sources to build reports for SEO, social, pay-per-click (PPC) advertising and more.

Whatagraph’s pre-made widgets help users quickly link and edit data-driven reports with blocks for text comments and custom images.
You can save widgets and reports as templates and reuse them to make regular reporting less time-consuming.
Pricing: paid plans start at $249 per month, billed annually. Users can request a free trial on Essential and Advanced plans.
Final thoughts
There’s more to client reporting than a regular check-in. Reports let you prove your value, educate clients about your work and share insights that shape the future of their business.
When creating a report, focus on what matters to the client. Keep data relevant to goals and use storytelling to paint a clear, honest picture.
A report that’s easy to understand ensures accurate decision-making and tells clients their account is in safe hands.
Check out Pipedrive to automate your email marketing reports and sales reporting efforts so you can focus on hitting client targets.